| _ |
|---|

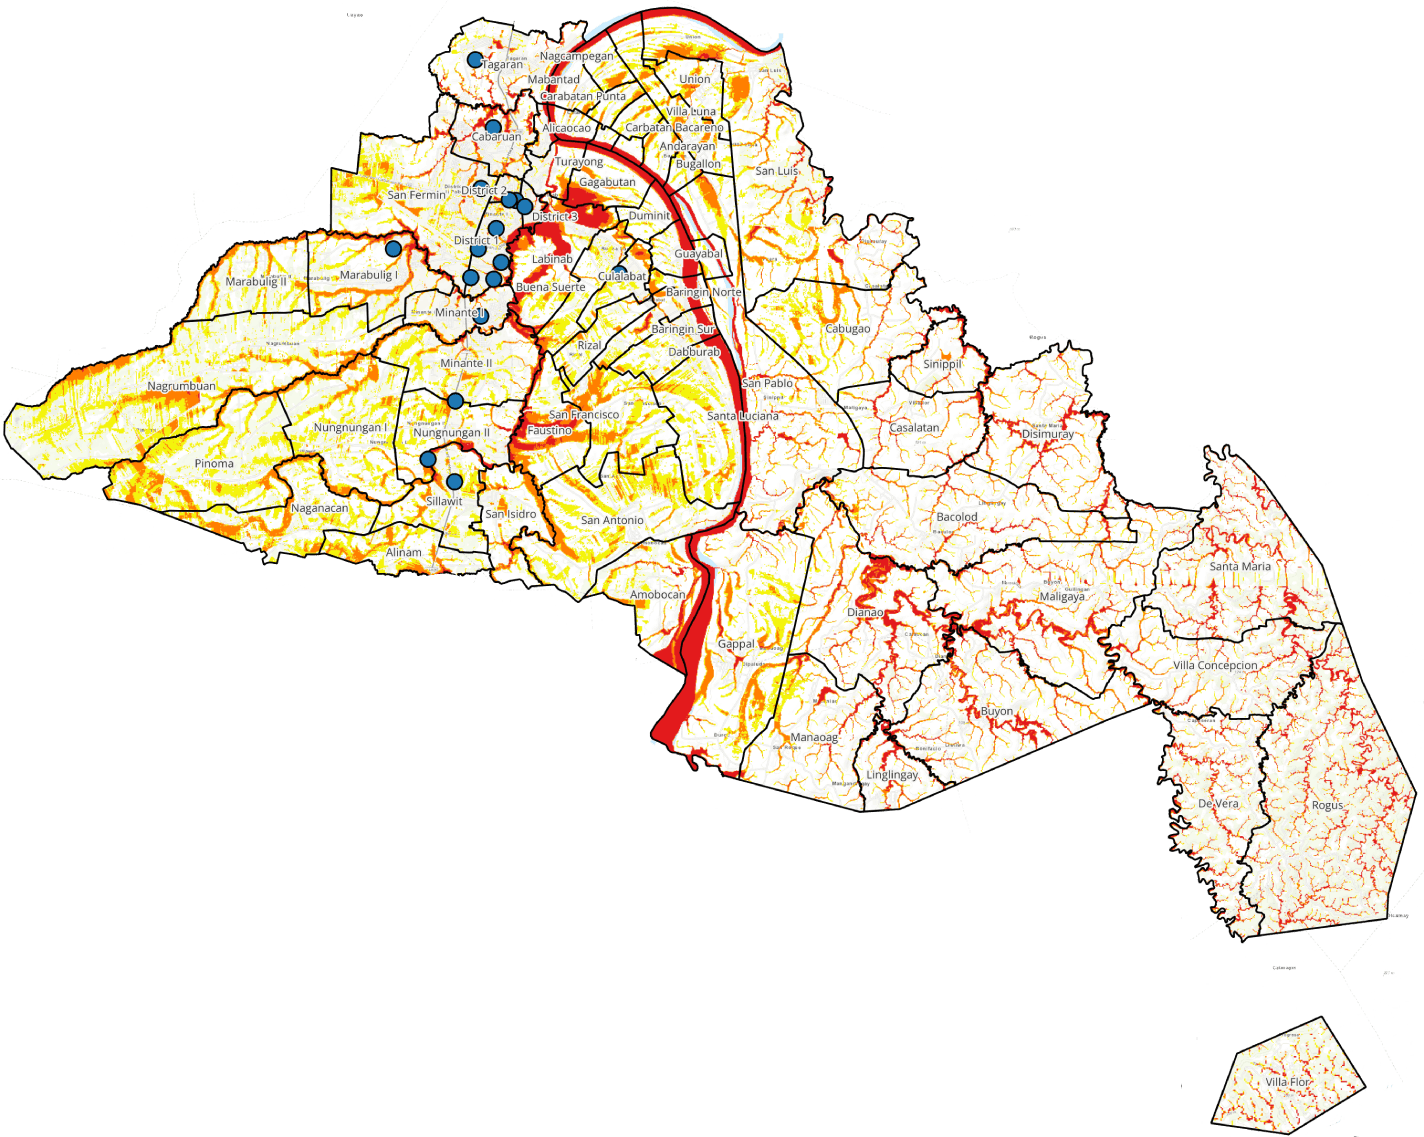
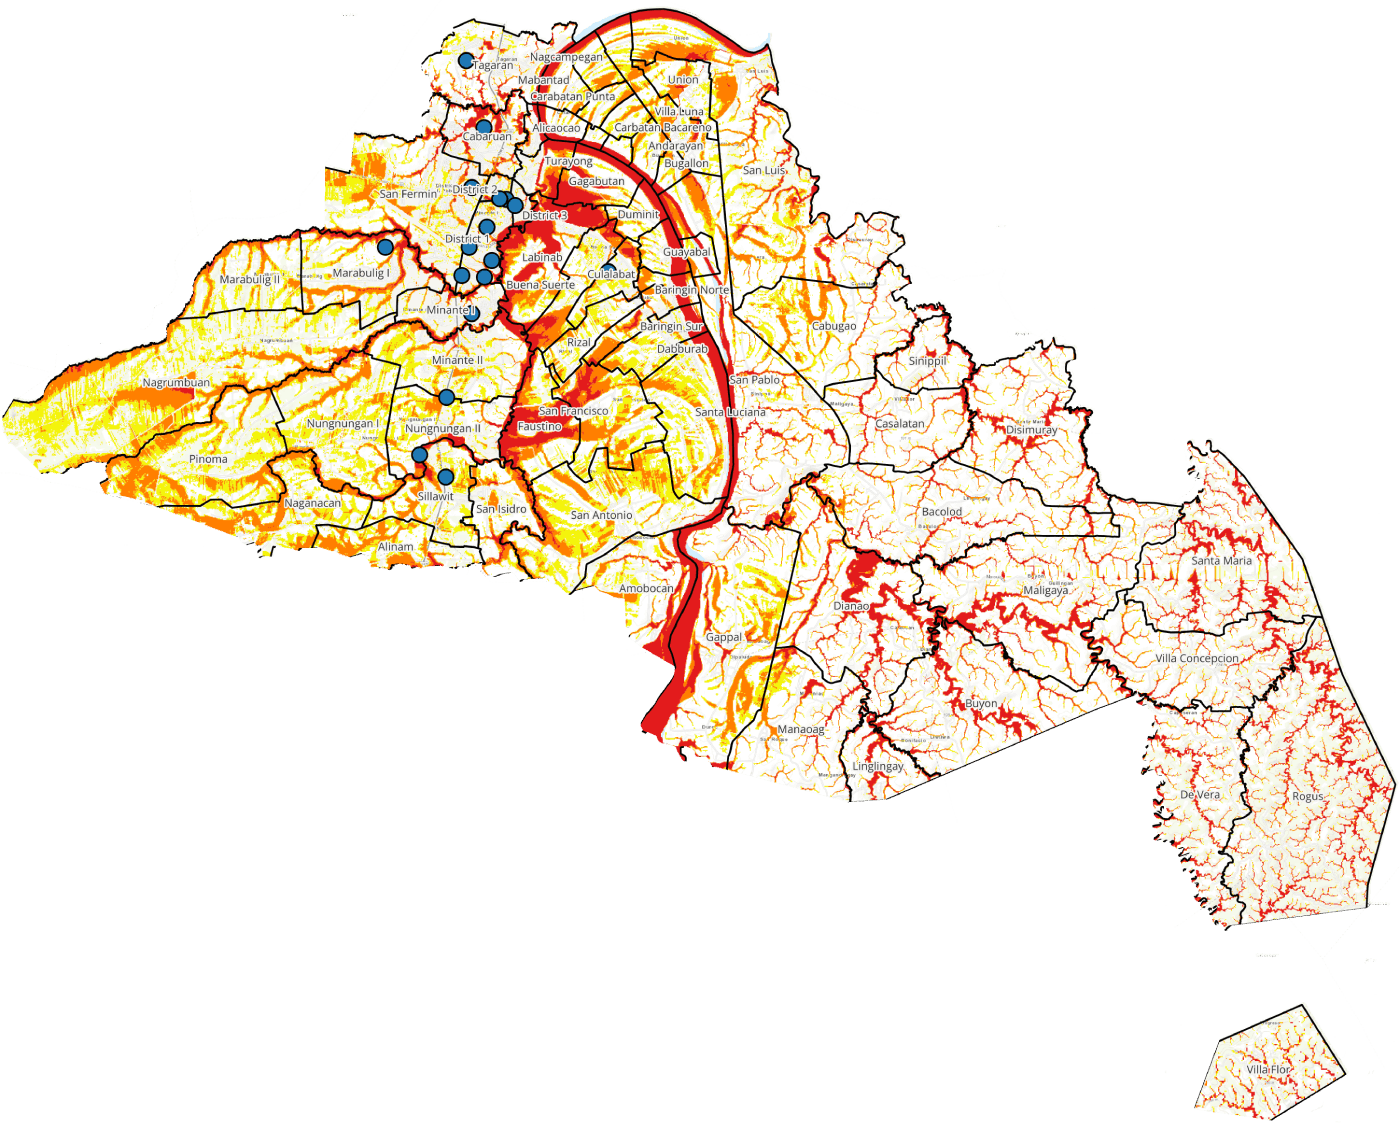
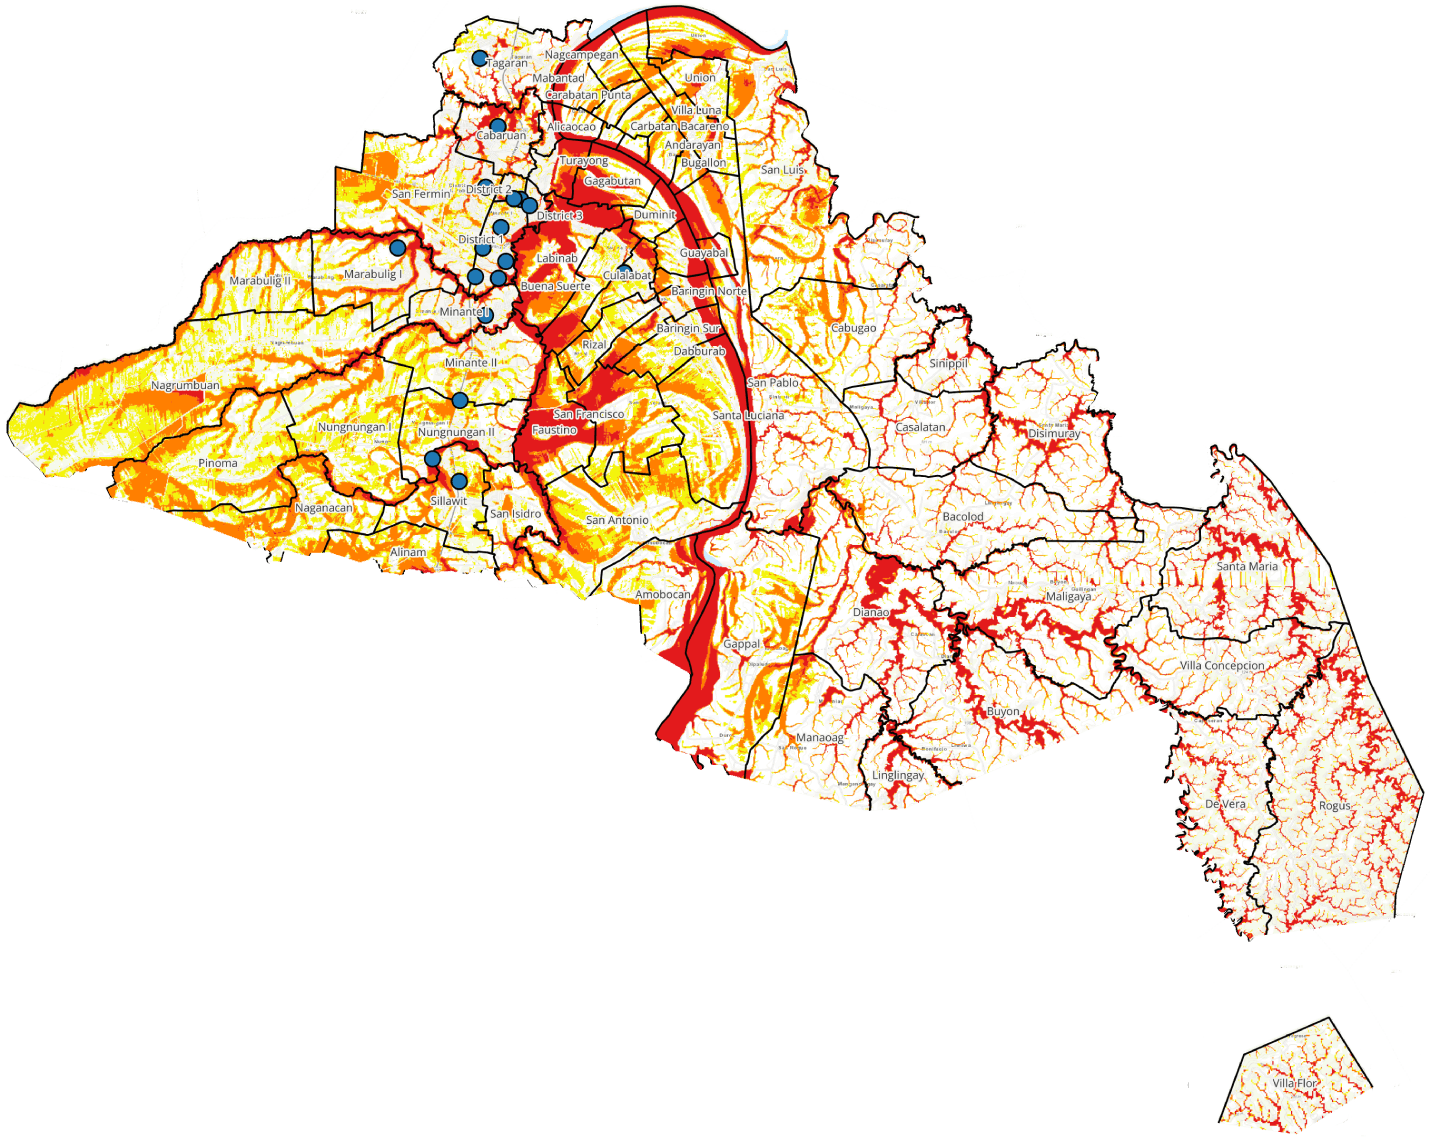
GroundShaking Hazard MapCauayan City. Isabela This is a composite map of estimates of maximum intensities for carious earthquake scenarios that may affect the study area intensities were detemine using a deterministic method. fault parameters and maximum credible magnitude used for different scenario were based on the intrmental seismicity, historical seismicity and |
Liquefaction Hazard MapCauayan City. Isabela this was based on the geology, earthquake source zone, historical accounts of liquefaction, geomorphology and hydrology of the area and preliminary microtremor survey data utilize to validate type of underlying materials. |
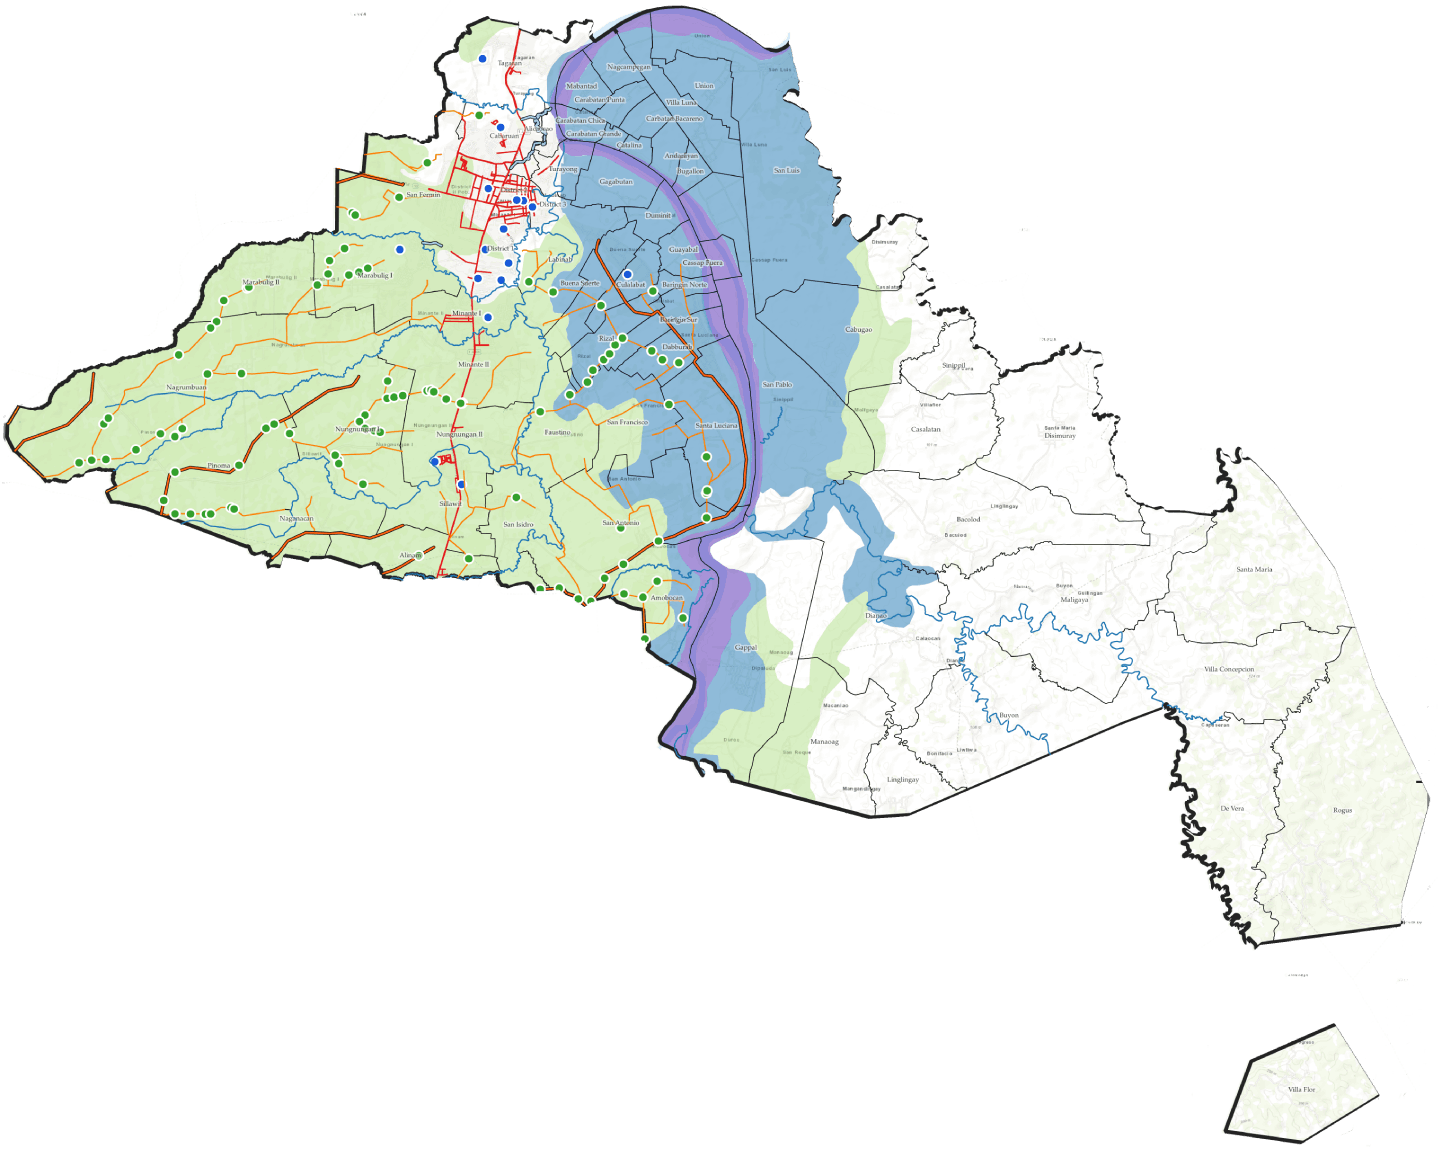
Flood Hazard Map Under 5-year Rain Return PeriodCauayan City. Isabela This shapefile, with a resolution of 10 meters, Illustrates the inundation extents in the area if the actual amount of rain exceeds that of a 100 year-rain return period. There is a 1/5(20%) propability of a flood with 5 year return period occuring in a single year. |
Flood Hazard Map Under 25-year Rain Return PeriodCauayan City. Isabela This shapefile, with a resolution of 10 meters, Illustrates the inundation extents in the area if the actual amount of rain exceeds that of a 100 year-rain return period. There is a 1/25(4%) propability of a flood with 25 year return period occuring in a single year. |
Flood Hazard Map Under 100-year Rain Return PeriodCauayan City. Isabela This shapefile, with a resolution of 10 meters, Illustrates the inundation extents in the area if the actual amount of rain exceeds that of a 100 year-rain return period. There is a 1/100(1%) propability of a flood with 100 year return period occuring in a single year. |